




Why this was hard
Three things made this more than a file-upload form.
- Too much to check by hand. A run can carry 30+ parameters and 1,500+ rows. Nobody audits that line by line, so the check had to work at a glance.
- A wrong reading looks like a right one. The model reads most files correctly, but a misread one, say with the wrong time column, still looks clean. Scientists aren't AI experts, so they can't be expected to spot what's off. The design had to show how each file was read in their terms, so a mistake is easy to catch and fix before import.
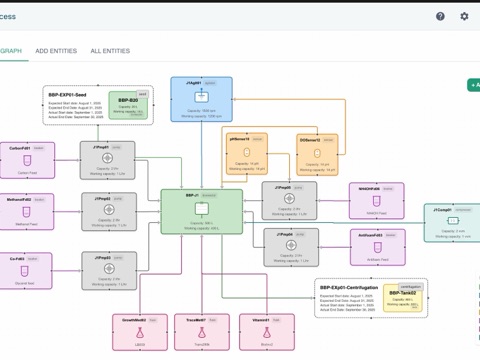
- The system thinks in tables; the lab thinks in runs. The prototype asked users to pick one of four ways to reshape the data, named in engineers' terms. The design had to make most of those choices for them and phrase the rest in lab terms.
Key design decisions
Three decisions shaped the flow.
The model proposes, the scientist commits
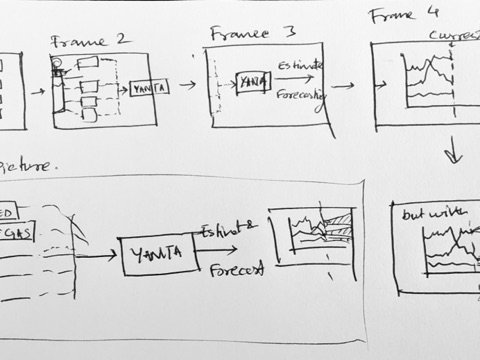
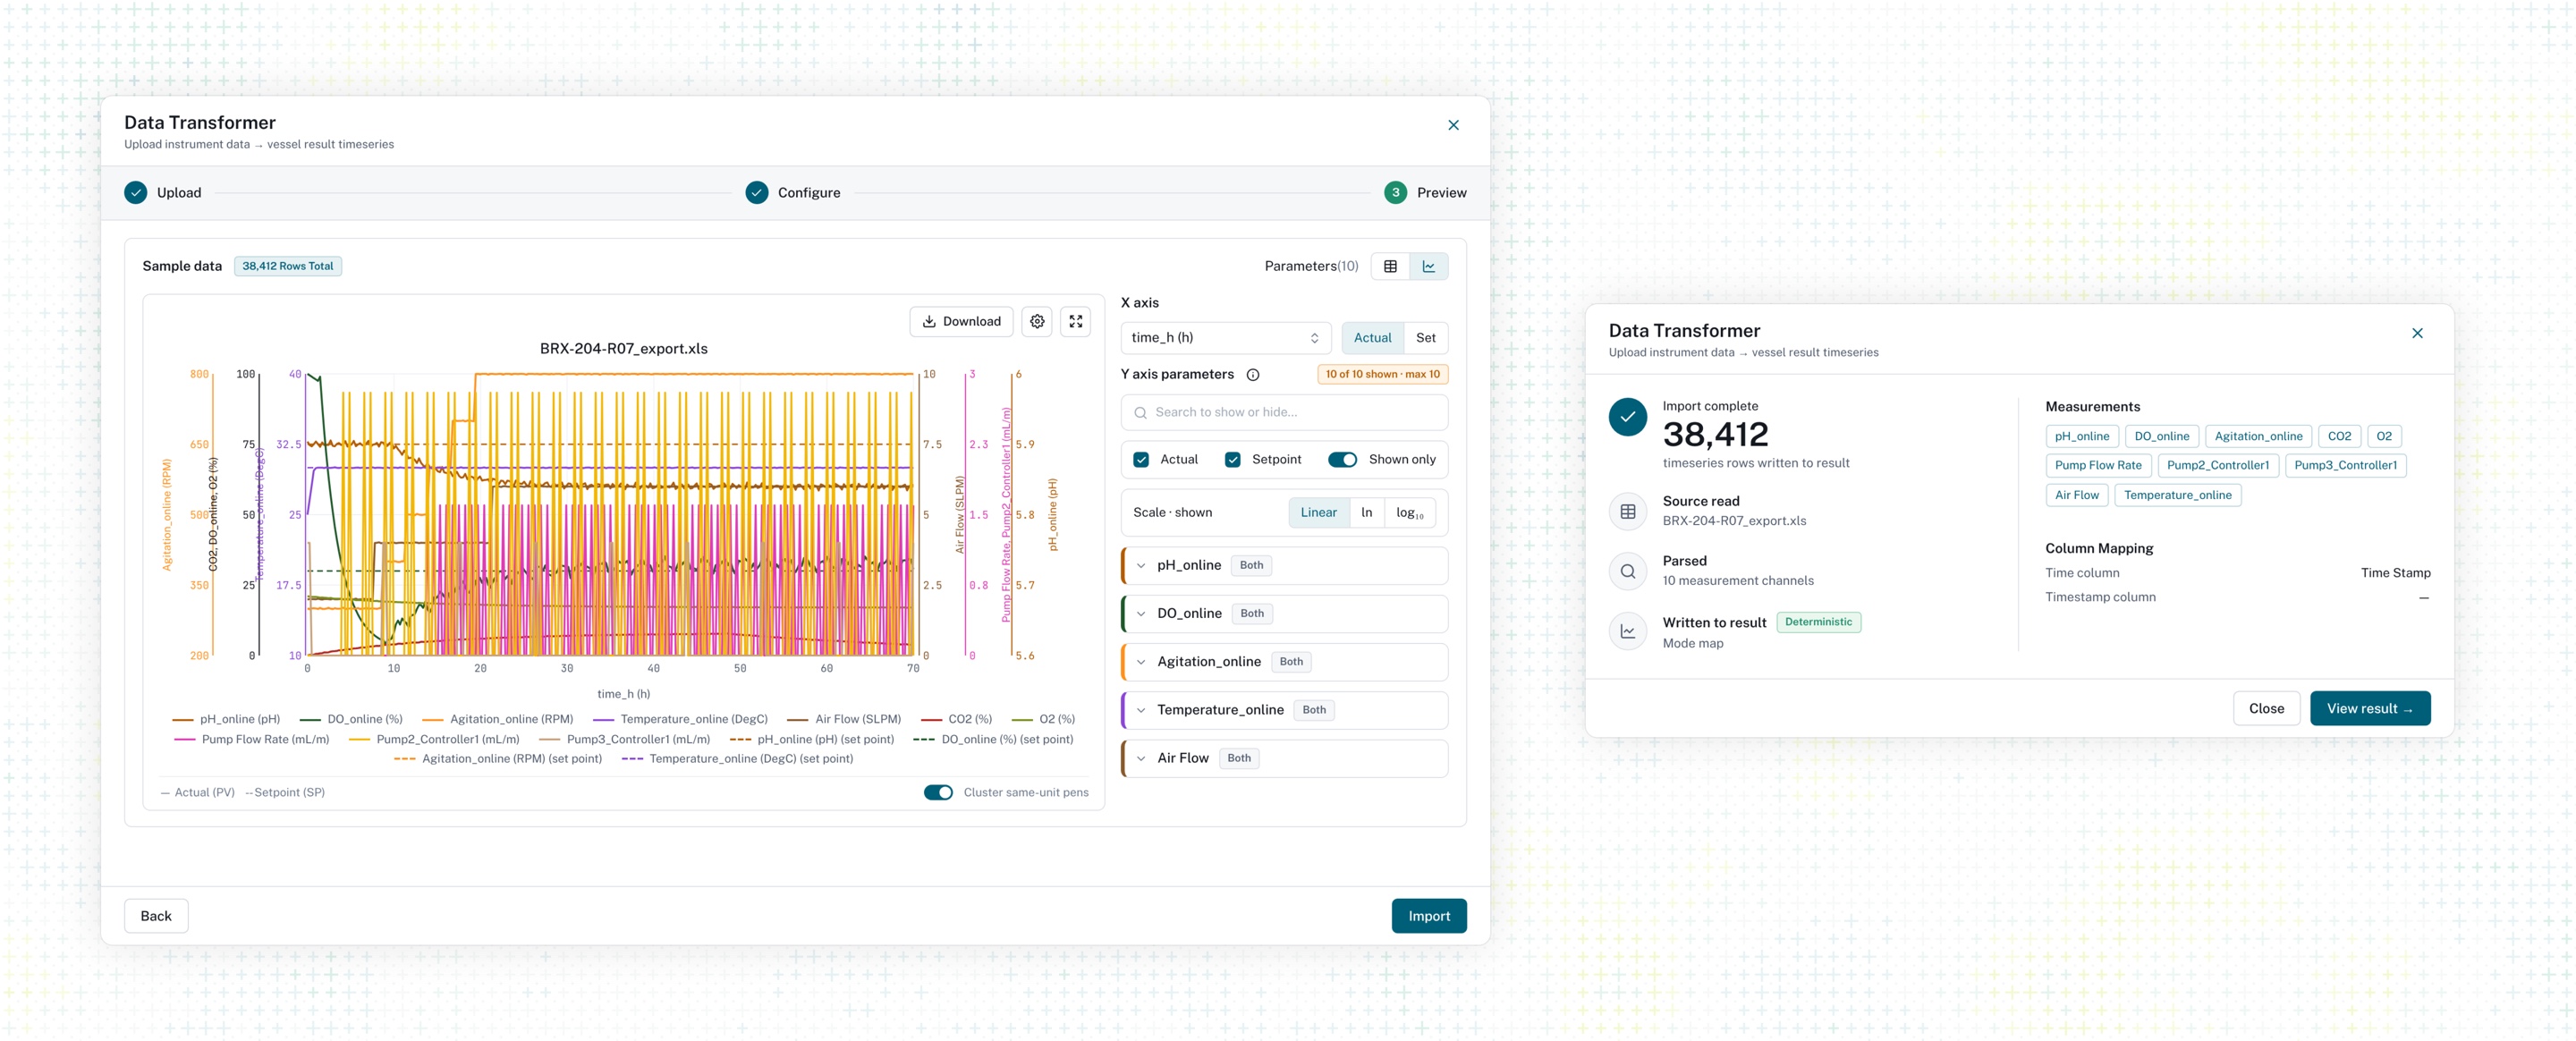
The model reads the file and proposes how to turn it into results: which column is time, what each measurement is, and its units. The scientist sees that proposal in plain terms before anything is saved: a sample of the parsed rows, the layout it detected, and names and units they can edit. Units come from Yanta's own list and stay blank when the model can't match one. If the reading is off, Re-parse runs it again.
Errors that stop the upload look different from warnings that don't, so a scientist knows whether to stop or just take a look. Nothing is saved until they press Import, a label chosen over "Transform" because it says what happens to the record.
The graph is the checkpoint, not the table
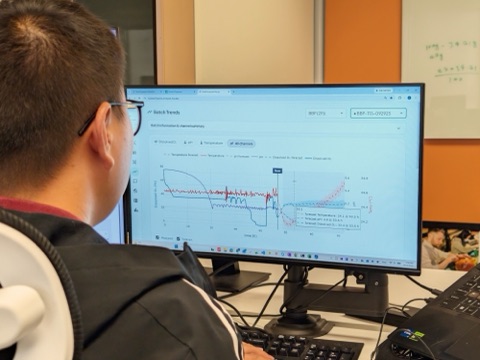
Scientists judge a run by its curves. A flat line, a spike or a cut-off time axis is obvious in a chart and invisible in rows. So the graph sits on both the configure and preview steps.
Templates make the hundredth upload predictable
The first versions bet on fresh detection for every file. In practice a lab uploads the same few formats again and again, and wants the same result each time, including formula columns like cumulative volume. Saved templates shipped in October: pick one on upload and names, units, formulas and table settings come with it.
Detection is now how a new format gets onboarded, not a step every file goes through.
What's next
- Test with scientists before the next round of changes. Run structured usability sessions on their own exports: upload, review, fix a wrong reading. The survey gave a score; watching sessions shows where people hesitate and why.
- Make every re-parse teach the parser. Today a re-parse starts over without knowing what was wrong. Next, it asks: a quick pick (wrong time column, units, layout or missing rows) plus an optional note in plain words. That context steers the retry, and each correction becomes a real example the data science team can test and improve the parser against. Grew out of an August request; not started.