



Why this was hard
Three constraints shaped the design.
- Trust without reviewing the SQL. A chart that looks right but isn't is worse than no chart. A model writing SQL infers intent from the prompt and the schema, and can still land on the wrong column or unit. So anyone, whether they read SQL or not, had to be able to check an answer quickly, without the chat feeling like a code review.
- A regulated record. Under GxP, the assistant can read data but never change it, so we needed to communicate the boundaries effectively, and nothing goes into the workbook unless a person adds it.
- Built for more than the workbook. This panel is the first step toward an assistant people can reach from anywhere in Yanta. So every pattern had to hold up beyond the workbook, on screens with different data, actions and edge cases.
Key design decisions
Three decisions shaped how the assistant lives in the workbook and earns trust.
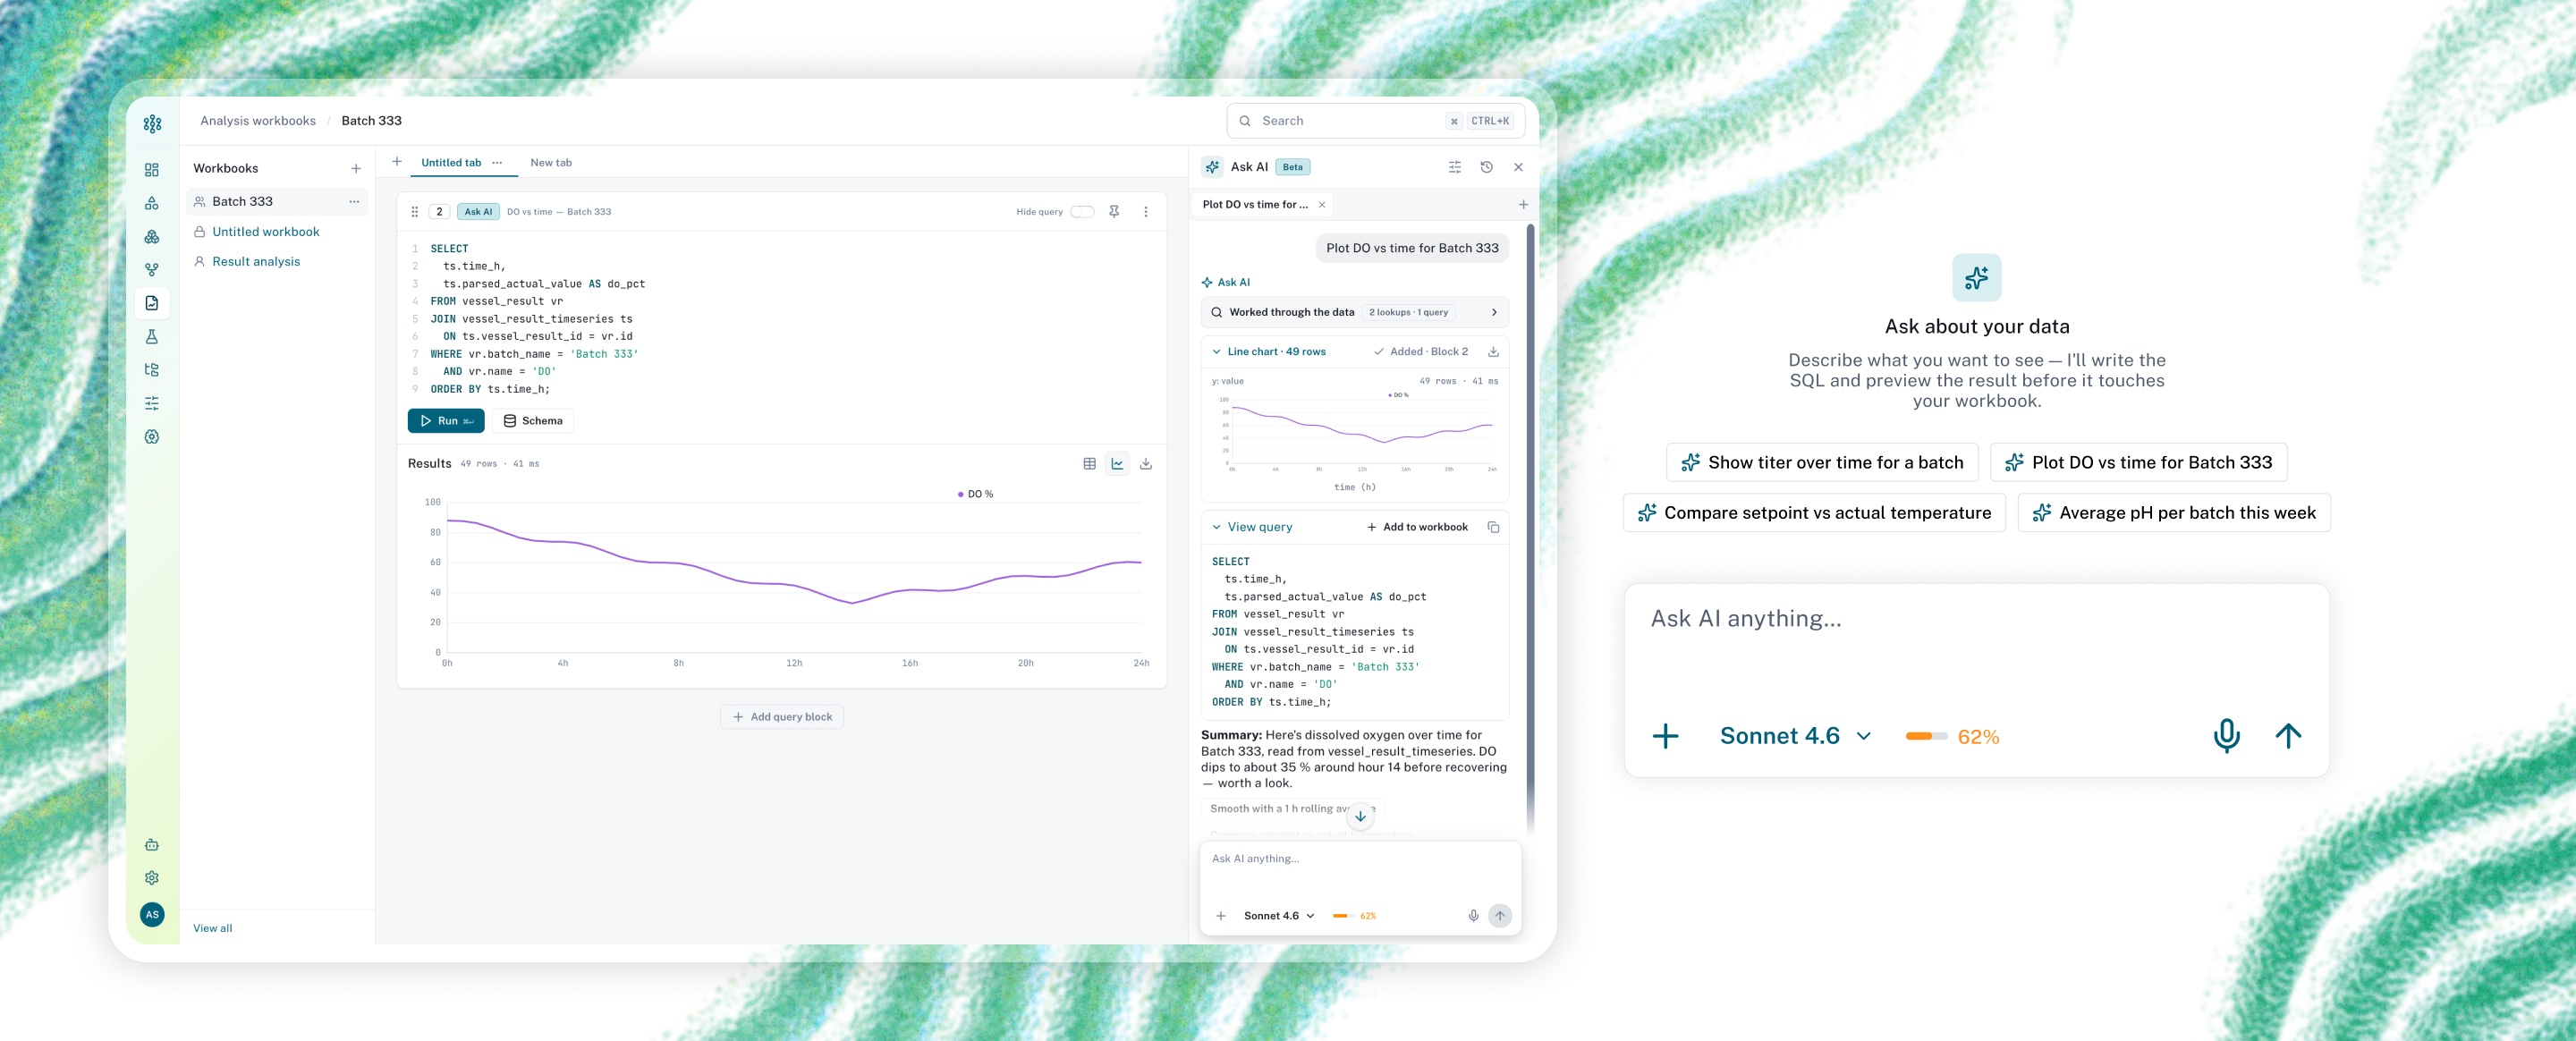
Response structure: output first, process on demand
Every answer follows the same structure, so people only learn it once.
- Working state. While it runs, the assistant says what it is doing: "Exploring the schema…", "Writing the query…", "Running it…".
- Process details. Collapsed by default, because the model's steps can run long so too much information can overwhelm the user.
- Output. Following that is the output or the chart, because the outcome is what people came for.
- Query. The SQL sits under the chart, with options to copy or Add to the workbook.
Lead with the chart, keep the SQL in reach
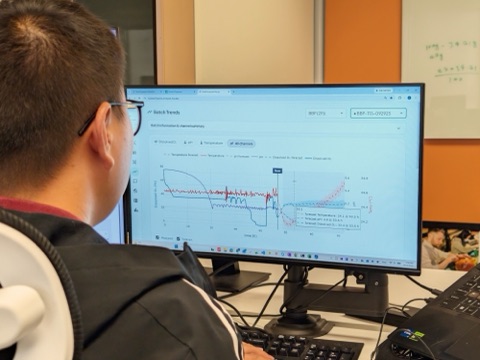
Scientists look at process graphs all day. They spot a dip in DO or a drift in pH much faster in a chart than in a table. So the response leads with a chart, with the SQL right below it.
People see the outcome first and open the working only when they want to know how the model got there or they see a problem.
The response never shows the raw table, which can run to thousands of rows. Once the answer is added to the workbook, the block holds the SQL and the results, and people can switch between chart and table views.
Make the model and the budget legible
Most scientists don't know how one model differs from another, or how that choice impacts their output. So each option is described in plain words, a now-common pattern in AI products: Fastest, Balanced (recommended), Most capable. A usage meter shows how much of the monthly limit is left and warns before the user hits their limit.
What I would do differently
- Test the entry point before hand-off. The nudge sits in a corner, but people get stuck in an empty query block. I would test both spots with the lab first.
- Lead with the trade-off, not the model name. Scientists choose by speed or depth, not by model name.
- Instrument from day one. I would agree on a few success numbers before hand-off, so the outcome could be measured.
What's next
The same assistant comes to the batch-record report next, then grows into the product-wide assistant. That adds ways to clarify unclear requests, a confirmation step before any change, and labels showing where each number came from. Also planned: an audit-ready AI marker, saved prompts and real usage data.